
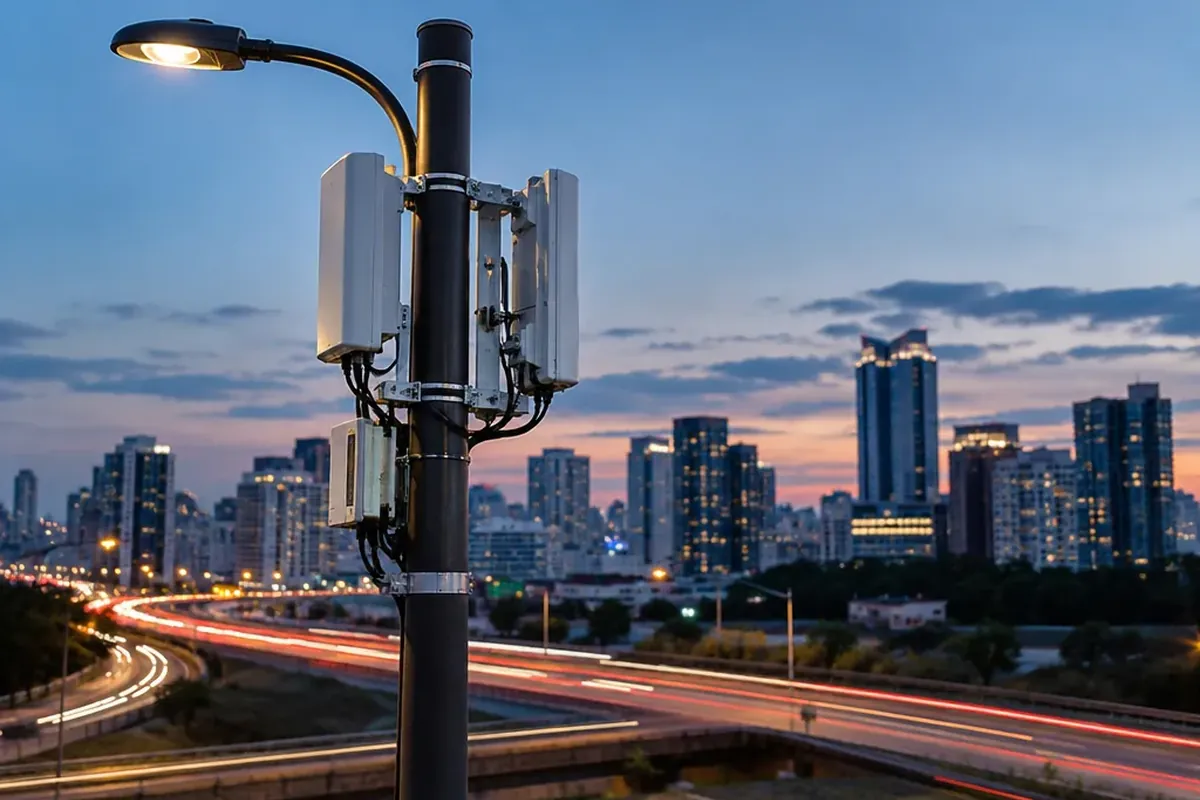
The real-world 5G network speed most users encounter daily sits between 150 Mbps and 300 Mbps on mid-band spectrum. That is 3 to 6 times faster than typical 4G LTE, but far below the 20 Gbps peak written into the standard. Millimeter-wave connections can reach a median of 1,800 Mbps, yet only close to a transmitter. What you actually get depends on the frequency band, signal strength, cell congestion, and your device.
Spectrum Tiers: How Low-Band, Mid-Band, and mmWave Define 5G Network Speed
5G runs on three frequency layers, each trading range against speed:
- Low-Band (Sub-1 GHz): Operating between 600 MHz and 900 MHz (such as T-Mobile’s n71 band), low-band delivers a median download speed of 65 Mbps, barely faster than 4G LTE.
- Mid-Band and C-Band (1 GHz to 6 GHz): Mid-band encompasses 2.5 GHz spectrum (n41 at T-Mobile) and C-band frequencies at 3.7 GHz (n77 at Verizon). Mid-band 2.5 GHz yields a median download rate of 185 Mbps, while C-band reaches a median of 320 Mbps download, 38 Mbps upload, and 18 ms latency.
- High-Band Millimeter-Wave (24 GHz to 100 GHz): Defined by the ITU in Frequency Range 2 (FR2) starting at 24.25 GHz and extended by 3GPP up to 71 GHz across bands such as n257, n258, n260, and n261, millimeter-wave (mmWave) delivers median downloads of 1,800 Mbps and uploads of 220 Mbps. However, these speeds are available only in direct line of sight and within 150 meters of a transmitter.
| Frequency Tier | Frequency Range | Median Download Speed | Median Upload Speed | Median Latency | Effective Outdoor Range |
|---|---|---|---|---|---|
| Low-Band (e.g., n71) | 600–900 MHz | 65 Mbps | — | — | — |
| Mid-Band (e.g., n41) | 2.5 GHz | 185 Mbps | 15–30 Mbps | 18–28 ms | — |
| C-Band (e.g., n77) | 3.7 GHz | 320 Mbps | 38 Mbps | 18 ms | — |
| mmWave (e.g., n260) | 24–40 GHz | 1,800 Mbps | 220 Mbps | 8 ms | Under 150 meters |
Real-World Carrier Benchmarks and Verizon 5G Network Speed
Independent benchmarks show clear differences between the national carriers. In SpeedTestHQ data, T-Mobile leads mid-band performance nationally with a median download speed of 245 Mbps. In Opensignal measurements, T-Mobile recorded median downloads of 247.4 Mbps, AT&T reached 223.5 Mbps, and Verizon recorded 179.2 Mbps.
On higher frequencies, the real-world Verizon 5G network speed changes noticeably. Verizon’s own network performance sheet lists 163 Mbps to 622 Mbps download and 35 ms to 55 ms latency for its 5G Ultra Wideband mobile service. While Verizon’s mmWave nodes reach a median of 1,800 Mbps, RootMetrics field testing discovered that mmWave connections accounted for only 2.2% of Verizon user tests, 0.2% of AT&T tests, and near 0% of T-Mobile connections. Phones rarely connect to mmWave cells at all.
Theoretical Limits vs. Real Connections: The Reality Gap
The ITU IMT-2020 standard specifies theoretical downlink ceilings of 20 Gbps and uplink limits of 10 Gbps under laboratory conditions with a single user. In commercial production networks, the highest peak speed recorded under field conditions reached 5.9 Gbps. Everyday mid-band users see median speeds of 150 Mbps to 300 Mbps, roughly 1% to 2% of the theoretical maximum.
Regulators abroad see the same gap. The United Kingdom’s communications regulator, Ofcom, recorded typical median 5G throughput between 50 Mbps and 200 Mbps in Connected Nations data, in contrast to advertised peaks of 1 Gbps to 2 Gbps. This gap stems primarily from shared spectrum resources, where a cell sector serves multiple devices simultaneously, alongside signal degradation caused by distance and physical obstacles.
Architecture Matters: Standalone vs. Non-Standalone Networks
The core network behind the radio affects how responsive a connection feels. Most carriers first rolled out Non-Standalone (NSA) 5G, which pairs 5G radio transmitters with an existing 4G LTE Evolved Packet Core (EPC). NSA routes the control plane over LTE while using 5G for the data plane. Standalone (SA) 5G replaces the 4G core entirely with a dedicated 5G Core (5GC), enabling technical features such as network slicing, Voice over New Radio (VoNR), and reduced latency.
Download speed peaks are often similar on NSA and SA networks because both architectures use the same radio spectrum. The key advantage of SA lies in connection consistency and lower ping times. Globally, 5G SA reduces latency by approximately 23% compared to NSA. In regional benchmarks, Hong Kong recorded a 43% latency reduction on SA, while France measured a 31% improvement. Ofcom also found that 5G SA completed file downloads about 45% faster than NSA, although SA carried only about 2% of UK connections in that measurement period.
Hardware and Network Equipment: 5G Network Speed on Huawei Gear
The device on your end also caps what you can reach. For 5G network speed on Huawei hardware, the 5G CPE Pro 2 home router is a typical example: it supports 11 5G bands, both SA and NSA, and carrier aggregation, for a theoretical peak download of 3.6 Gbps. Like every spec-sheet peak, real speeds stay well below that.
On the network side, China Unicom Beijing and Huawei run the “5G Capital” network with more than 10,000 base stations and a 1 Gbps uplink peak. At the 2nd World Humanoid Robot Games, they provided a dedicated 5G-Advanced network slice with 1 Gbps peak uplink and latency below 30 ms for remote robot control.
Physical Vulnerabilities: What Slows Down Your 5G Signal?
Cellular speeds depend on six main factors: spectrum band, cell congestion (time of day), signal strength, carrier aggregation, backhaul capacity, and device capabilities. High-frequency mmWave signals are particularly susceptible to physical signal attenuation:
- Human Obstruction: A user’s hand position can attenuate mmWave reception by 20 dB to 30 dB at a distance of 10 cm. Complete hand blockage terminates the signal entirely.
- Foliage and Vegetation: Tree cover introduces path loss, reducing mmWave signals by 17.7 dB for small trees and up to 26.4 dB for large trees.
- Precipitation: Moderate to heavy rainfall attenuates the strongest mmWave signals by approximately 6 dB.
- Building Materials: Penetration loss for 28-GHz mmWave reaches 29 dB to 32 dB for metal, 1 dB to 11 dB for wood, and 0.5 dB to 7 dB for standard glass. Energy-efficient low-emissivity (low-e) glass blocks mmWave so heavily that indoor throughput correlates directly with the width of an open window.
- Modem Thermal Throttling: Prolonged mmWave usage can cause smartphone modems to overheat, triggering automatic throttling to limit device skin temperature.
Common 5G Speed Myths and Misconceptions
Status icons and marketing terms cause a lot of confusion:
Myth 1: The “5G” status bar icon guarantees you are receiving 5G speeds. Carriers often display the 5G icon whenever a 5G transmitter is within reach, even if active data transfers are traveling over LTE.
Myth 2: 5G provides faster uplink and lower ping in every location. Field data say otherwise. A year-long crowdsourced research study across eight cities revealed that 5G uplink throughput was slower than 4G LTE in one city. In three of the eight cities surveyed, 5G exhibited higher latency than LTE links.
Myth 3: High-speed mmWave will blanket suburban neighborhoods. Assessments by the FCC determined that mmWave’s short range and weak building penetration confine deployments to dense hotspots and specialized locations. A single outdoor mmWave cell covers approximately 300 meters, and mmWave covers less than 1% of US locations. Even mid-band rollouts can stall: the US C-band launch was delayed for several months in early 2022 over FAA concerns about interference with aircraft radio altimeters, and AT&T and Verizon agreed to buffer zones around 50 airports.
Step-by-Step: How to Run an Accurate 5G Network Speed Test
A careless test often measures your Wi-Fi or a busy server instead of the cellular network. These steps give you an accurate 5G network speed test result:
- Turn Off Wi-Fi: Disable your smartphone’s Wi-Fi toggle completely to ensure the test evaluates the mobile network rather than a wireless router.
- Force a Clean Cell Handshake: Switch your phone into Airplane Mode for 10 seconds, then toggle it off to force a fresh connection to the optimal local cell tower.
- Terminate Background Traffic: Close background applications before testing. Cloud backups, video streaming, and active VPNs consume bandwidth and distort test results.
- Run Multiple Passes for a Median Result: Perform at least five separate tests over several minutes and record the median result, as a single measurement is not representative.
- Test Across Multiple Time Windows: Measure throughput during different periods of the day, as cell load peaks in residential areas during the evening and in business districts around midday.
For an ad-free option, the FCC Mobile Speed Test App on iOS and Android offers QuickCheck, Challenge, and Crowdsource modes and feeds the National Broadband Map. Also avoid testing again and again against one overloaded default server; a less busy server often gives more accurate results.
Frequently Asked Questions
Is 5G faster than LTE?
Yes. 5G delivers median download speeds between 150 Mbps and 300 Mbps, making it 3 to 6 times faster than typical 4G LTE speeds of 30 Mbps to 100 Mbps. For example, Ookla testing recorded T-Mobile delivering median downloads of 309 Mbps on 5G compared to 45 Mbps on LTE. Mid-band 5G upload speeds improve by 1.5 to 2.5 times over LTE (15 Mbps to 30 Mbps versus 8 Mbps to 15 Mbps).
How can I check my broadband speed?
Turn off Wi-Fi, close background apps, and use a speed test app such as the FCC Mobile Speed Test App. Switch Airplane Mode on for 10 seconds first to get a fresh cellular connection, then run at least five tests at different times of day and note the median.
What is mmWave 5G?
Millimeter-wave (mmWave) 5G refers to radio spectrum operating between 24 GHz and 100 GHz, used in mobile networks for the first time with 5G across bands such as n257, n258, n260, and n261. Unlike sub-6 GHz frequencies, mmWave offers carrier bandwidths up to 400 MHz, enabling theoretical speeds above 10 Gbps and median real-world downloads of 1,800 Mbps. However, its transmission range is under 150 meters, and signals are blocked by walls, tree foliage, rain, and the user’s hand.
Is 5G faster than NBN?
It depends on the technology. Australian 5G fixed wireless delivers typical speeds of 200 Mbps to 400 Mbps under good conditions, making it faster than legacy copper-based NBN Fibre to the Node (FTTN) connections that often achieve only 20 Mbps to 40 Mbps. However, NBN Fibre to the Premises (FTTP) delivers up to 2,000 Mbps with greater consistency; the Australian Competition and Consumer Commission (ACCC) measured fixed-line NBN achieving 100.5% of plan speeds during peak hours compared to 83.8% for fixed wireless.
What is the biggest disadvantage of 5G?
The biggest disadvantage of 5G is inconsistency. Speeds vary by a factor of 30x depending on the frequency band, and the fastest variant (mmWave) covers less than 1% of US locations, requiring dense microcell deployments with high capital investment.
Is anything faster than 5G?
Yes. Fiber is much faster: a 5-gig fiber plan measured median downloads of 5,699 Mbps and uploads of 5,992 Mbps, roughly 20 times mid-band 5G, and a 1-gig fiber plan showed a median latency of 3.97 ms. Next comes 6G (ITU standard IMT-2030), which targets peak rates of 50 Gbps to 200 Gbps; Japanese researchers have already sent 112 Gbps over an experimental 560-GHz terahertz link.